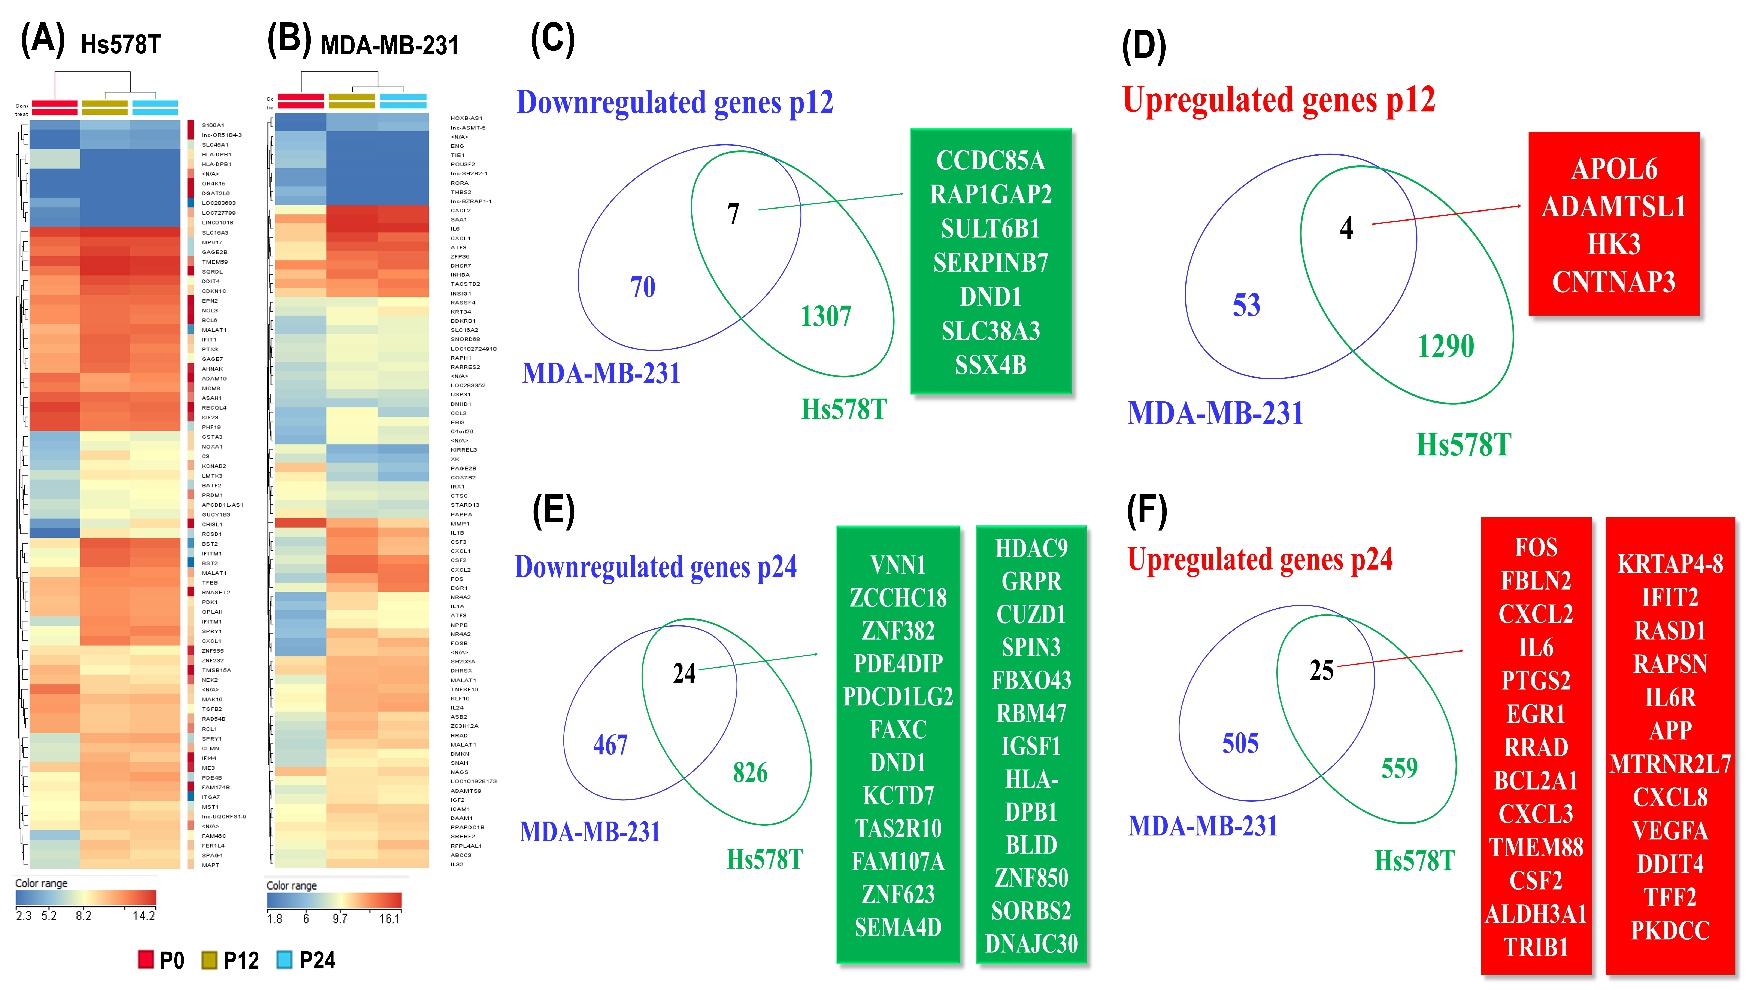
Fig. 4. Gene expression profiling of TNBC cell lines as effect of multiple dose exposure to paclitaxel. Heatmap emphasizing the altered genes signature at passage P12 and P24 in (A) Hs578T cell line and (B) MDA-MB-231 cell line; Venn diagram of the statistically significant (FC ± 2 and p-value ≤ 0.05) upregulated and downregulated gene expression by overlapping both TNBC cell lines; (C, D) common signature at p12, (C) downregulated and (D) upregulated genes selected cell line; (E, F) common signature at p24, (E) downregulated and (F) upregulated genes selected cell line.